NBS Signal ToolNifty · Bank Nifty · Sensex

The screen

Every image below is the browser tool itself, captured at 2x from a live session against a real Zerodha feed. Nothing here is a mockup and nothing is retouched — the account name is masked, and that is the only edit.

They were taken after the close, so the header reads Market closed and the day's total is zero. The signal, the levels and every indicator reading are the real ones from that session; nothing was put into a demo mode to be photographed.
The signal board
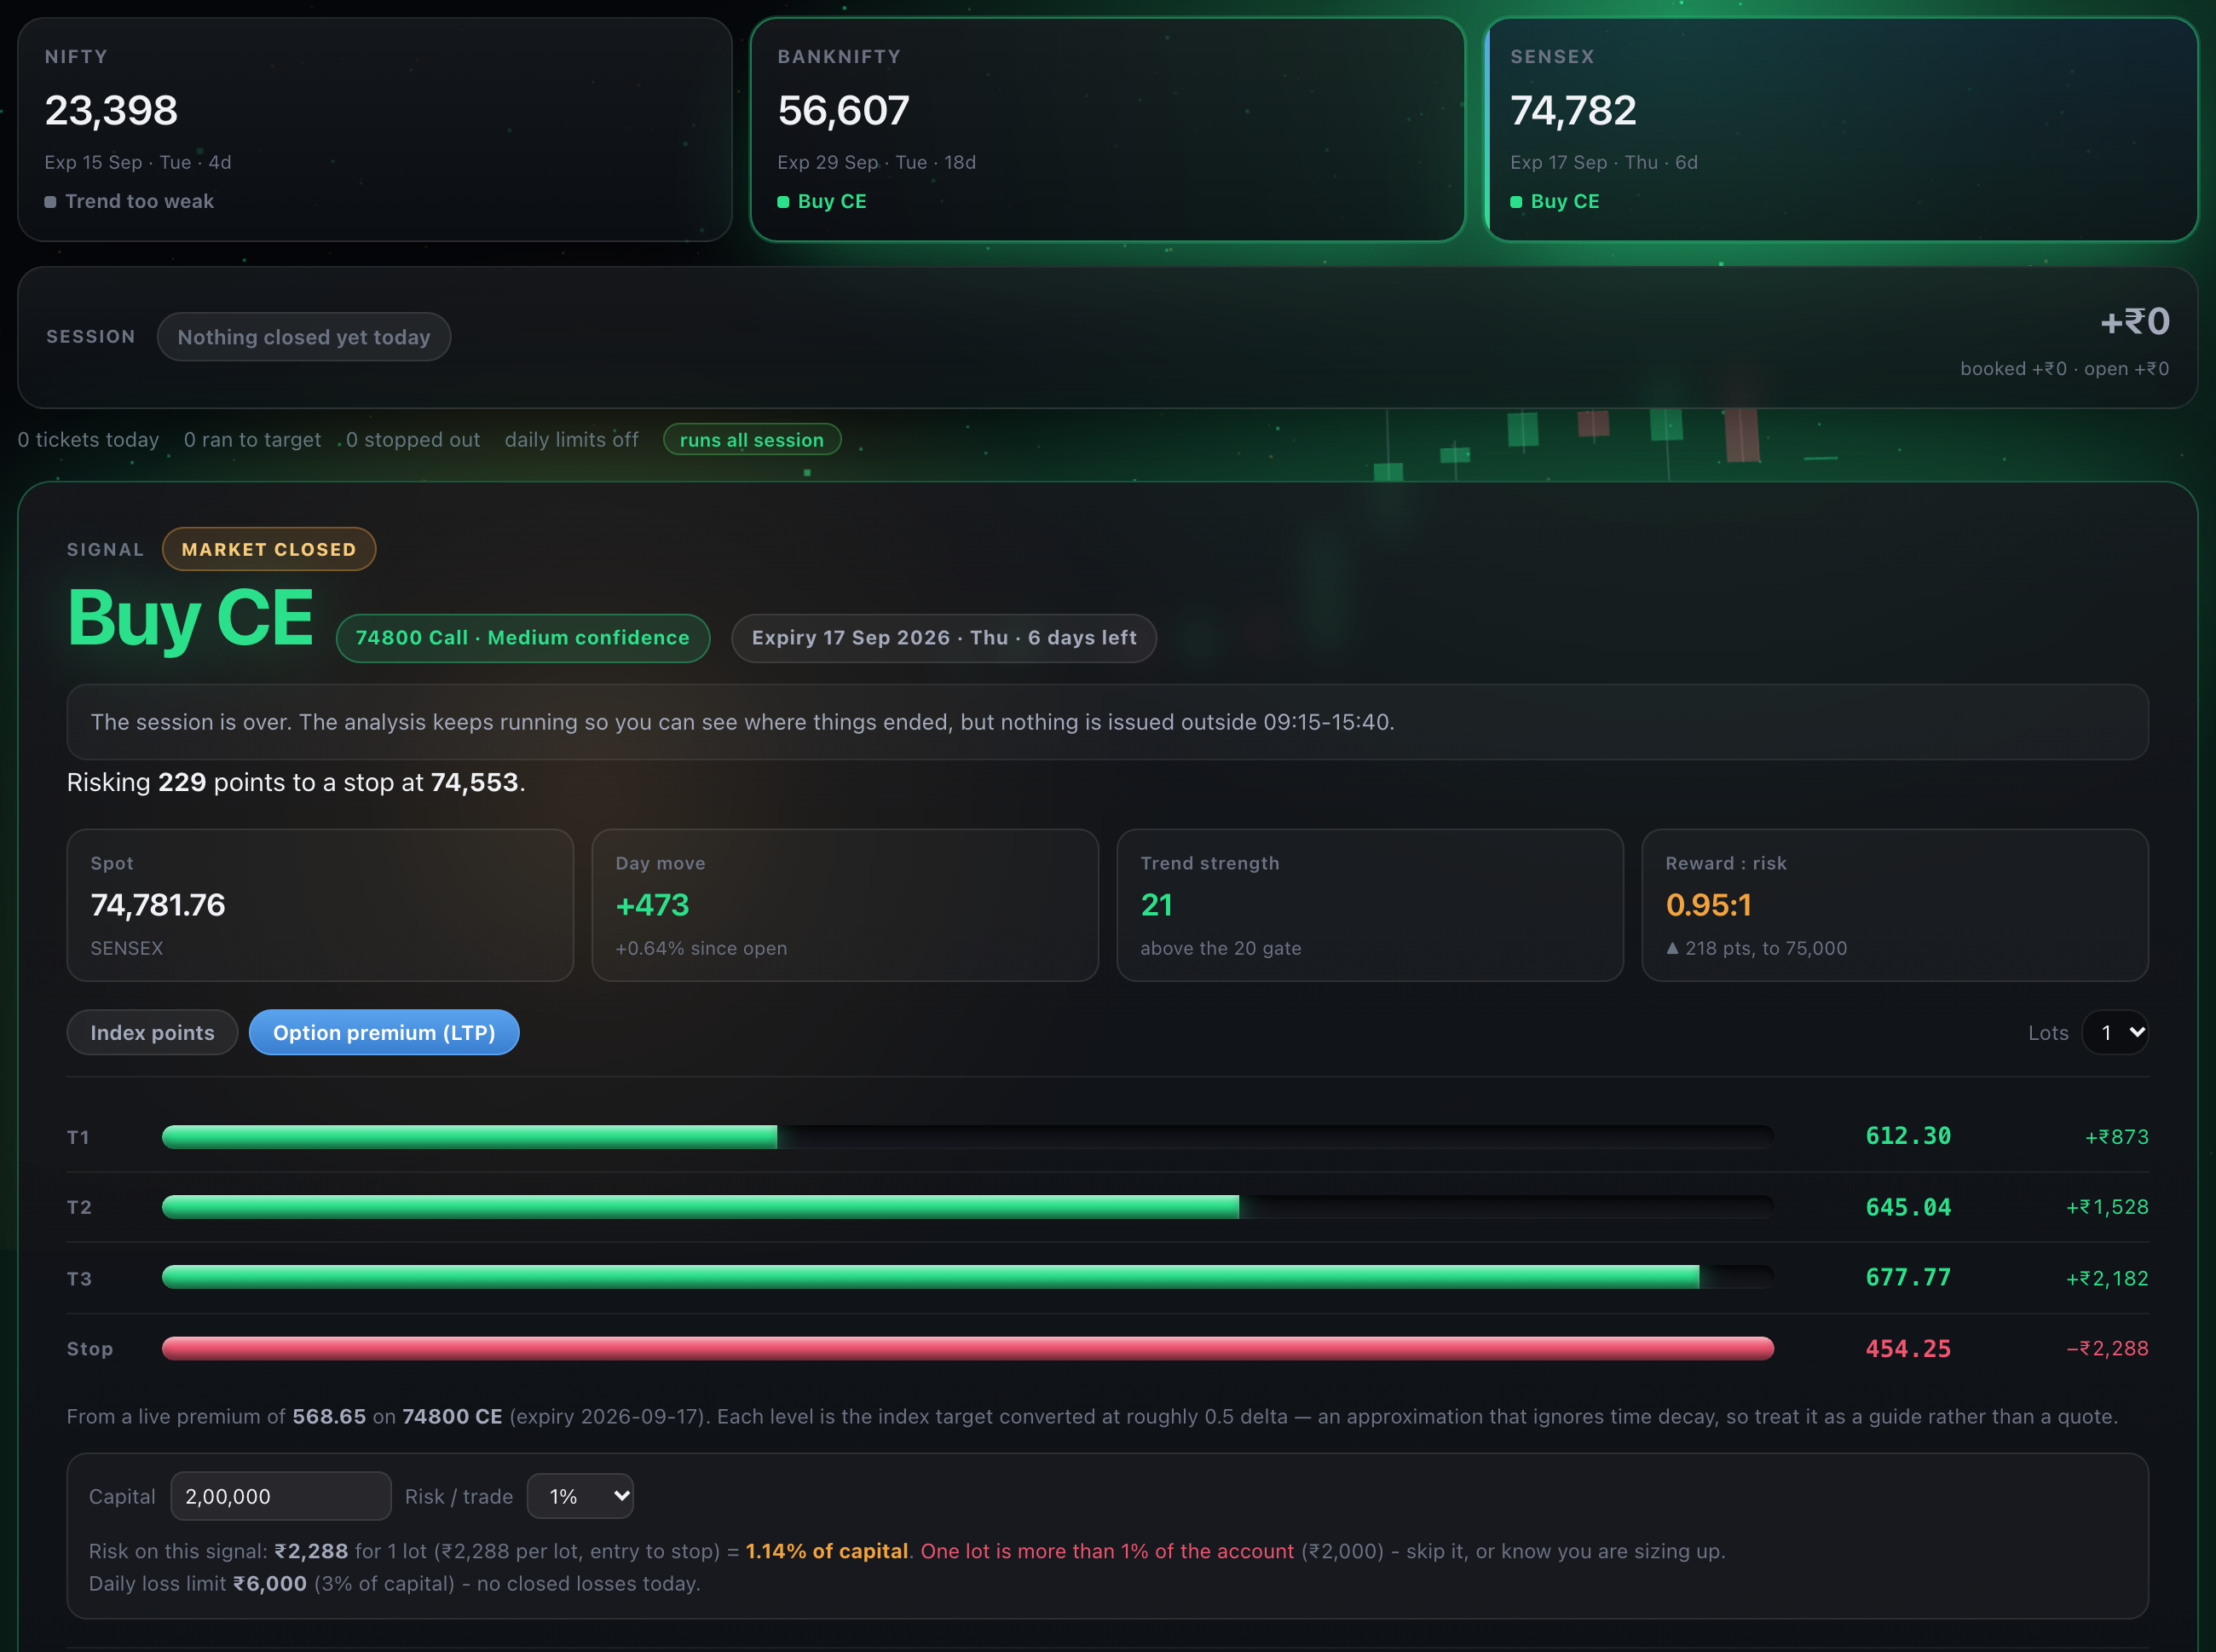
The signal boardSensex after the close: a Buy CE on the 74800 call, and a MARKET CLOSED badge saying exactly why no ticket was issued — the signal is still shown and explained, but nothing is taken outside 09:15–15:40. The expiry sits beside the contract, the ladder is in option premium with rupees per lot, and the risk box, filled in here with a sample ₹2,00,000 account at 1%, shows one lot would risk ₹2,464 — 1.23% of it, more than the 1% chosen, and it says so. Reward to risk is 0.89 : 1, so in session this one would be held as LOW REWARD.
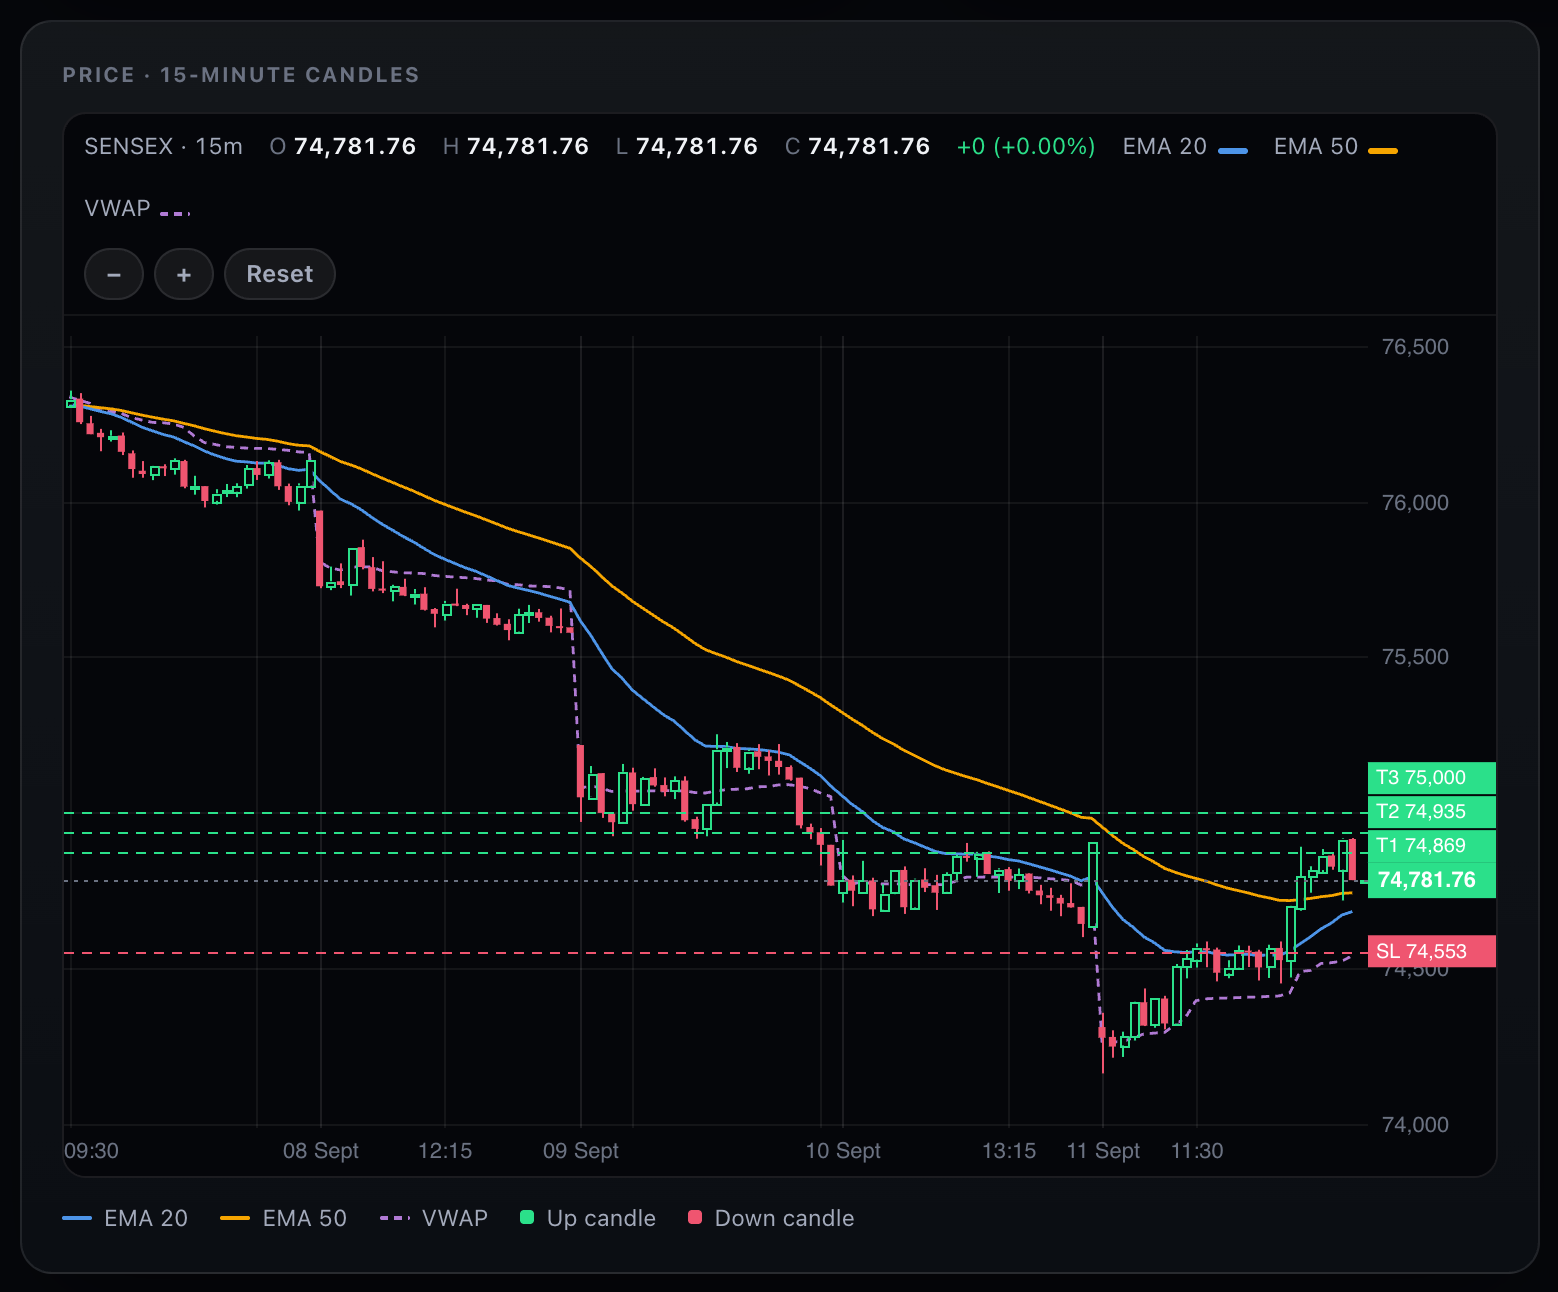
The chart
The chartFifteen-minute candles with both EMAs and a VWAP weighted by the index future’s real volume, and the same T1, T2, T3 and stop drawn as lines where they actually sit, their price tags kept apart so none hides another. Drag it to scroll back through earlier sessions; the right-hand candle is built from the live tick stream, so it moves before it closes.
Trend, day move and confidence
Trend, day move and confidenceThree readings the tool will not let you skip past. The trend box says NO CLEAR TREND, with the ADX and how far price has travelled in fourteen bars. The dial reads 100% and still labels it Medium, because all three inputs that voted agree but only three voted — High needs four. The number and the word are both shown, so one cannot flatter the other.
The market map
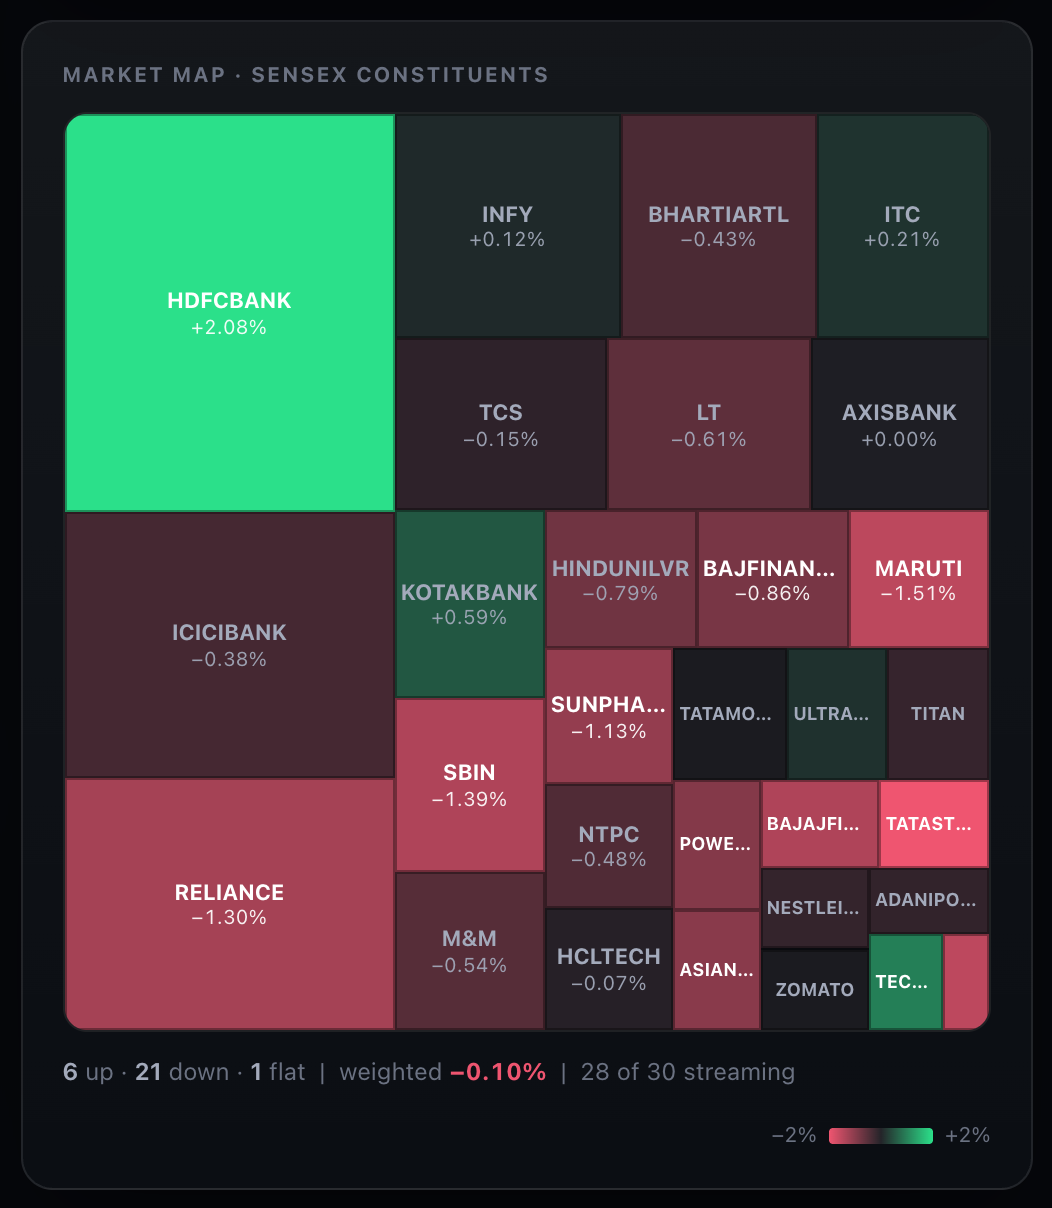
The market mapEvery index constituent sized by its weight and coloured by its move today, so you can see whether an index is being carried by two heavyweights or genuinely moving as a whole. Breadth is counted underneath — how many up, how many down, and how many are actually streaming right now.
Why — every input, in full
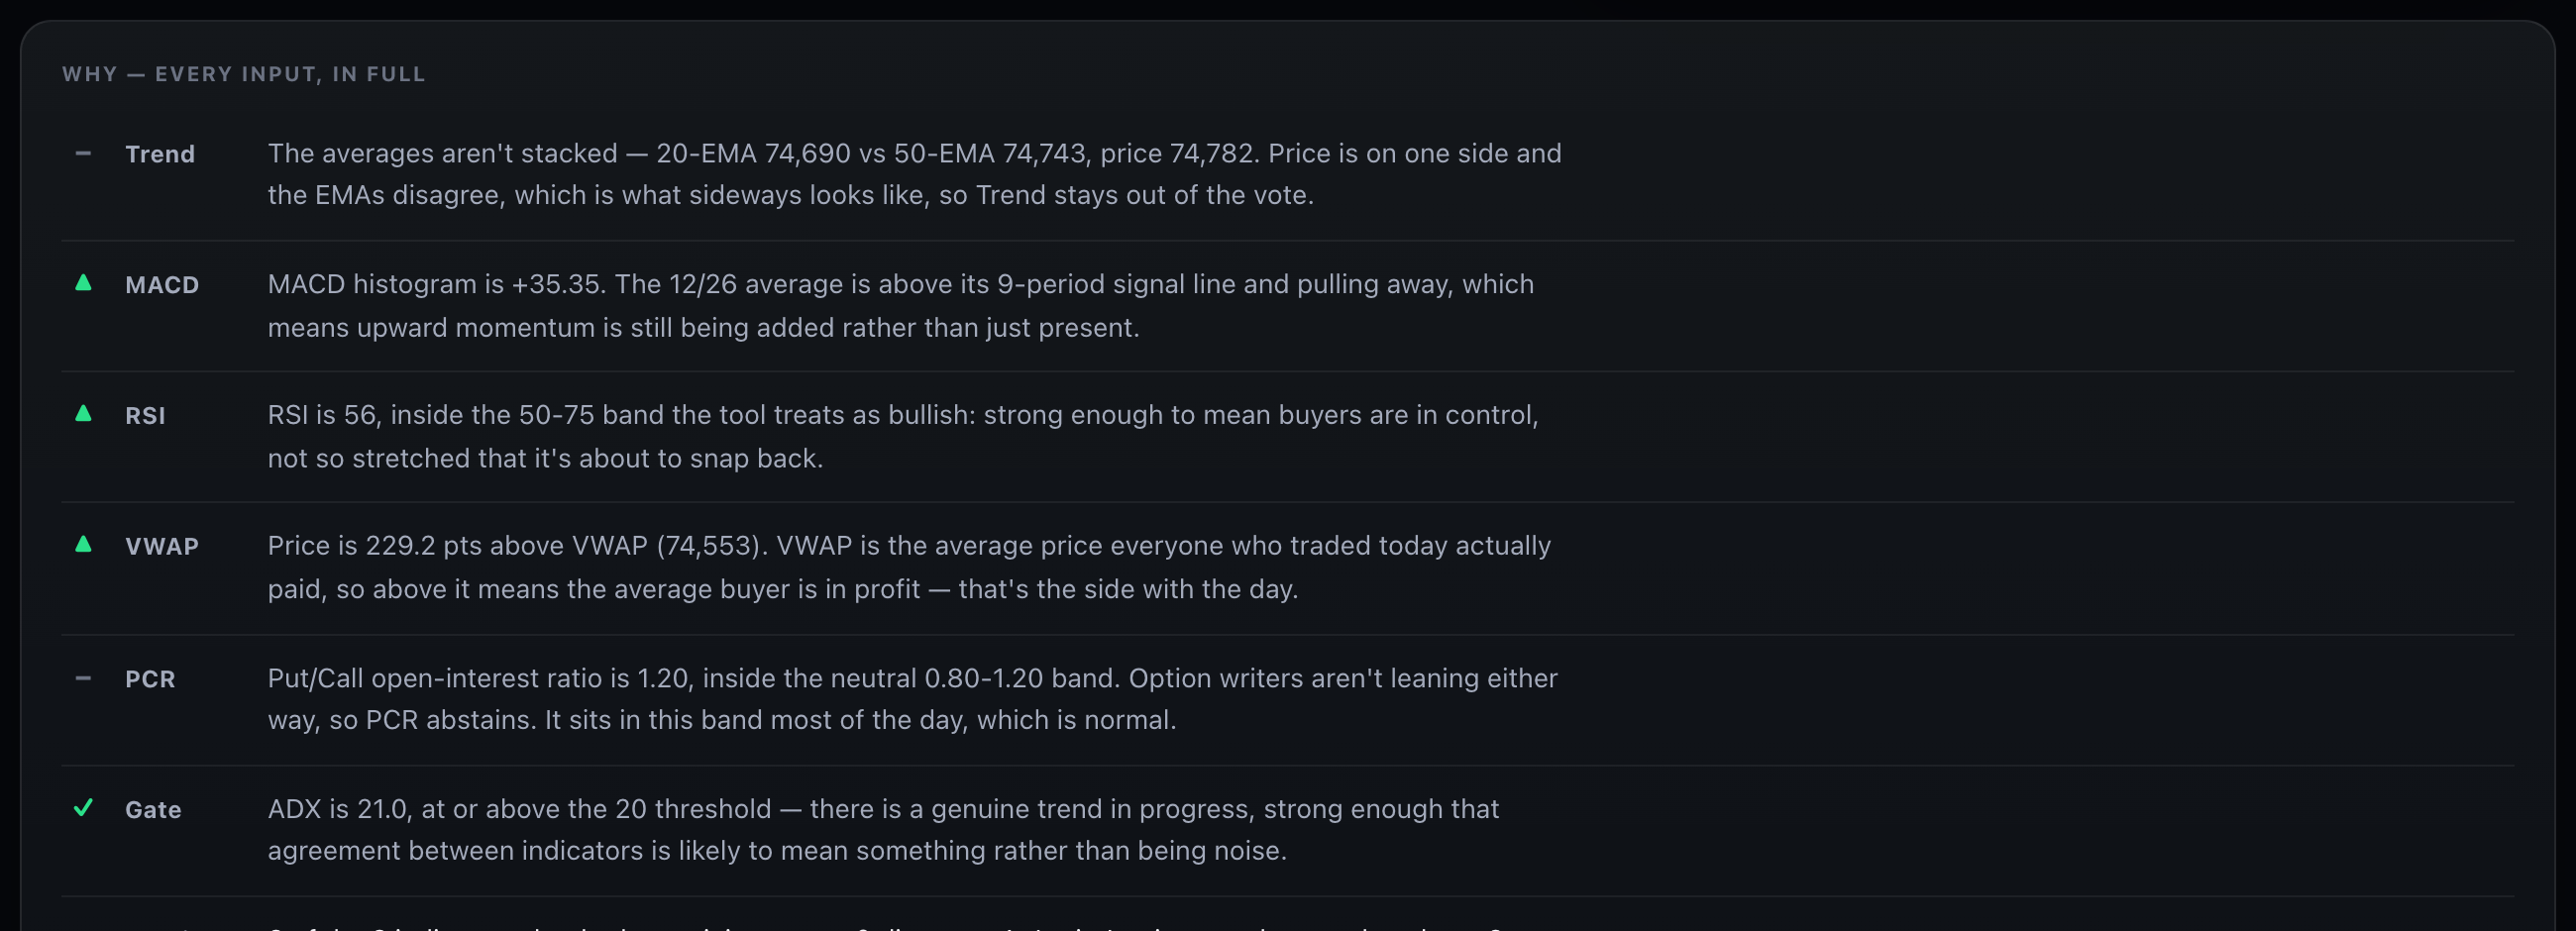
Why — every input, in fullThe reasoning, in sentences, for every input including the ones that abstained. Each says what it measured, what the threshold was and which way it voted. Trend and PCR abstain here and say why. Nothing that fed the verdict is left off this list, and nothing on it is a number without an explanation.
The whole screen
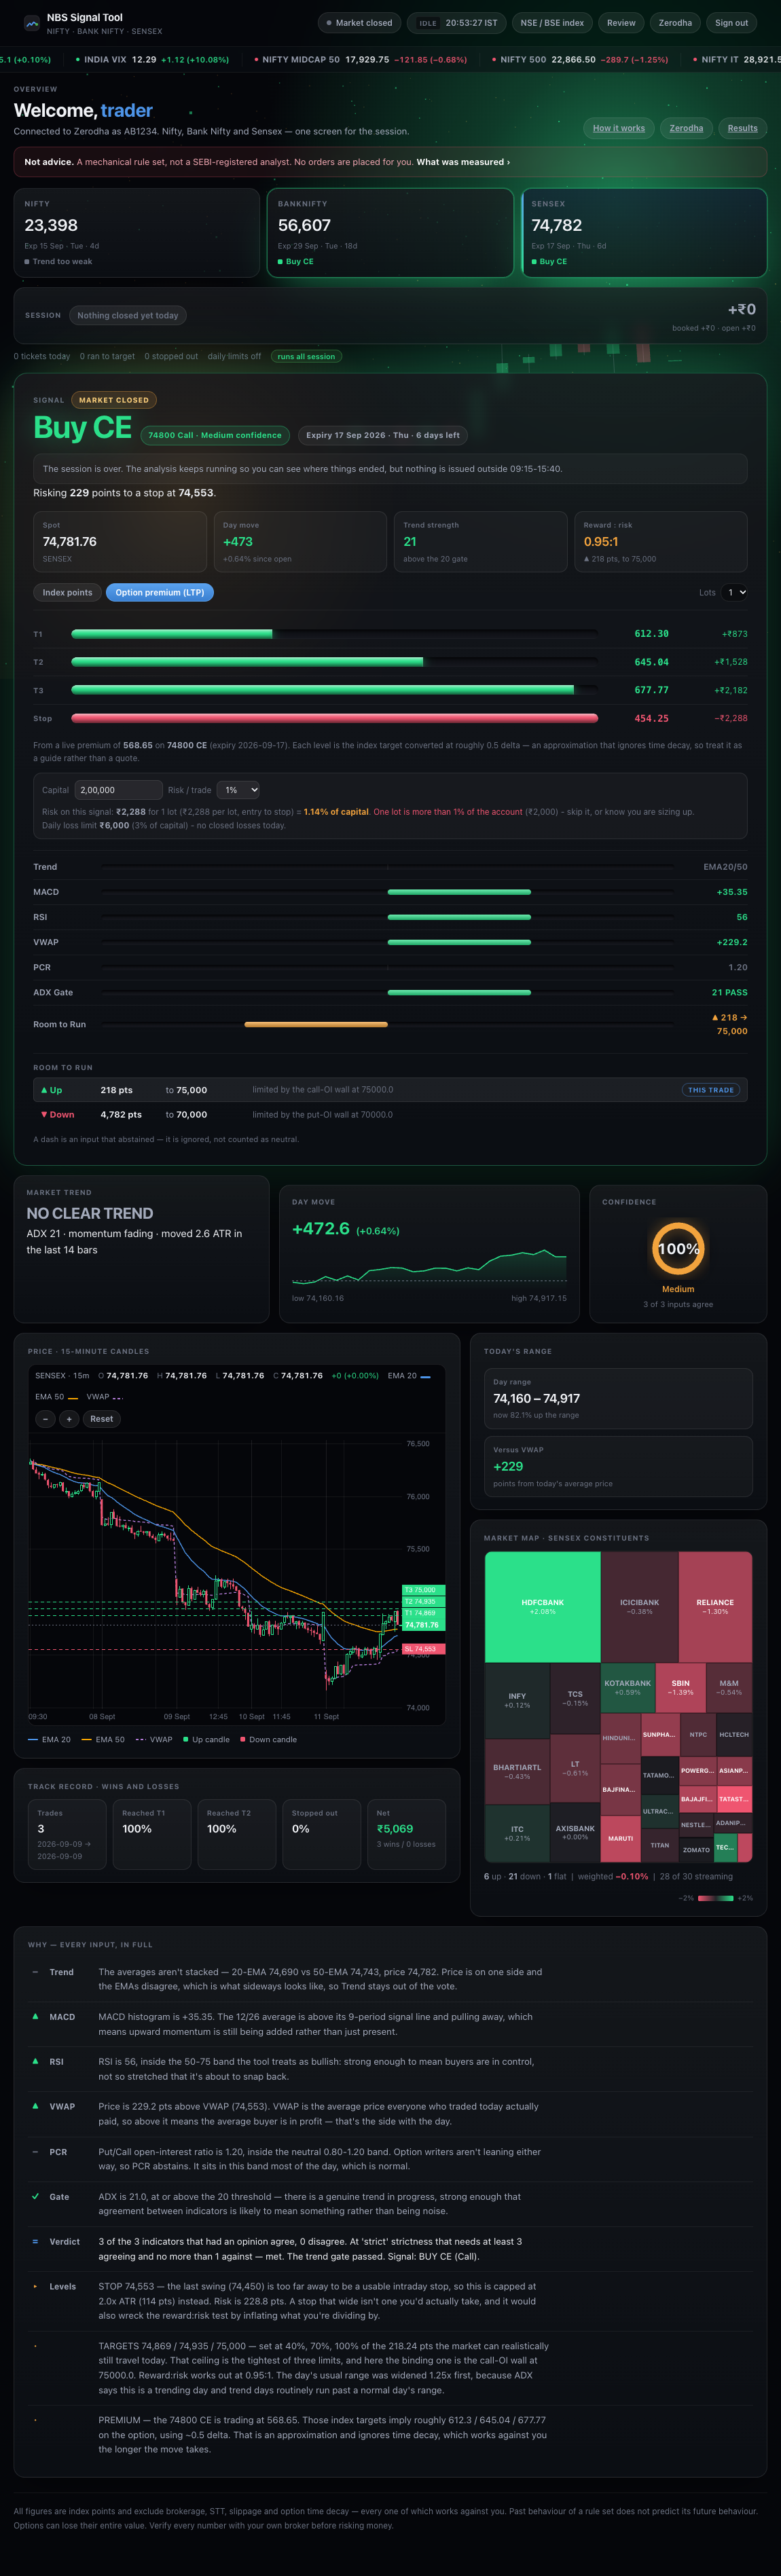
The whole screenOne page, one scroll: the three indices, the session total, the signal and its ladder, trend and confidence, the chart, today's range, the market map, the record, and the reasoning. There is no second tab and nothing is hidden behind a menu.

Everything on one page

There is no navigation inside the tool — no side rail, no tabs, no settings screen to go and find. The three indices, the signal and its ladder, the trend and confidence boxes, the chart, today's range, the market map, the record and the full reasoning are all on one page, in that order, and you reach any of them by scrolling.

The few things that are switches rather than places — index points against option premium, the lot count, whether the tool keeps running when the page is shut — sit beside what they affect instead of behind a menu.

Reading the signal board

PartWhat it is telling you
Signal ticketthe call itself — BUY CE, BUY PE, or nothing. OPEN means it is live and tracked; PREVIEW means a direction exists but no ticket was issued. When something is holding the entry, the badge says which: CONFIRMING, COOLDOWN, POSITION OPEN, DAY LIMIT, MARKET OPENING, CLOSING AUCTION or MARKET CLOSED.
Entry / Nowthe premium at issue, and the premium now. The rupee figure beside them is that difference across your chosen lots.
Reward : riskthe ratio computed at entry from ATR. Below the floor it never became a ticket at all.
T1 / T2 / T3the three targets, each with how far price has travelled toward it — a check mark and a timestamp once reached.
Stopwith the same progress bar, which is the one you actually want to be watching.
Confidencethe dial, with every input that fed it listed underneath. A dash means that input abstained and was ignored rather than counted as neutral.
Market trendthe plain-English label — RANGE-BOUND / CHOPPY, MODERATE DOWNTREND — with the ADX reading and how far price has actually displaced in ATR terms.
Sessioneverything closed today, in order, with the running total split into booked and open.